


An Introduction to R
Data Analysis and Visualization
- Useful for beginners and also as a reference for more seasoned veterans.
- Plenty of examples throughout, as well as additional notes and tips.
- Chapter summaries in concise table format help the book to be used as an ongoing reference work.
- data analysis
- modelling
- professional development
- r language
- statistics
Related Books

Description
The modern world is awash with data. The R Project is a statistical environment and programming language that can help to make sense of it all. A huge open-source project, R has become enormously popular because of its power and flexibility. With R you can organise, analyse and visualise data. This clear and methodical book will help you learn how to use R from the ground up, giving you a start in the world of data science.
Learning about data is important in many academic and business settings, and R offers a potent and adaptable programming toolbox. The book covers a range of topics, including: importing/exporting data, summarising data, visualising data, managing and manipulating data objects, data analysis (regression, ANOVA and association among others) and programming functions. Regardless of your background or specialty, you'll find this book the perfect primer on data analysis, data visualisation and data management, and a springboard for further exploration.
DOI: 10.53061/THEE2596
Table of Contents
1. A brief introduction to R
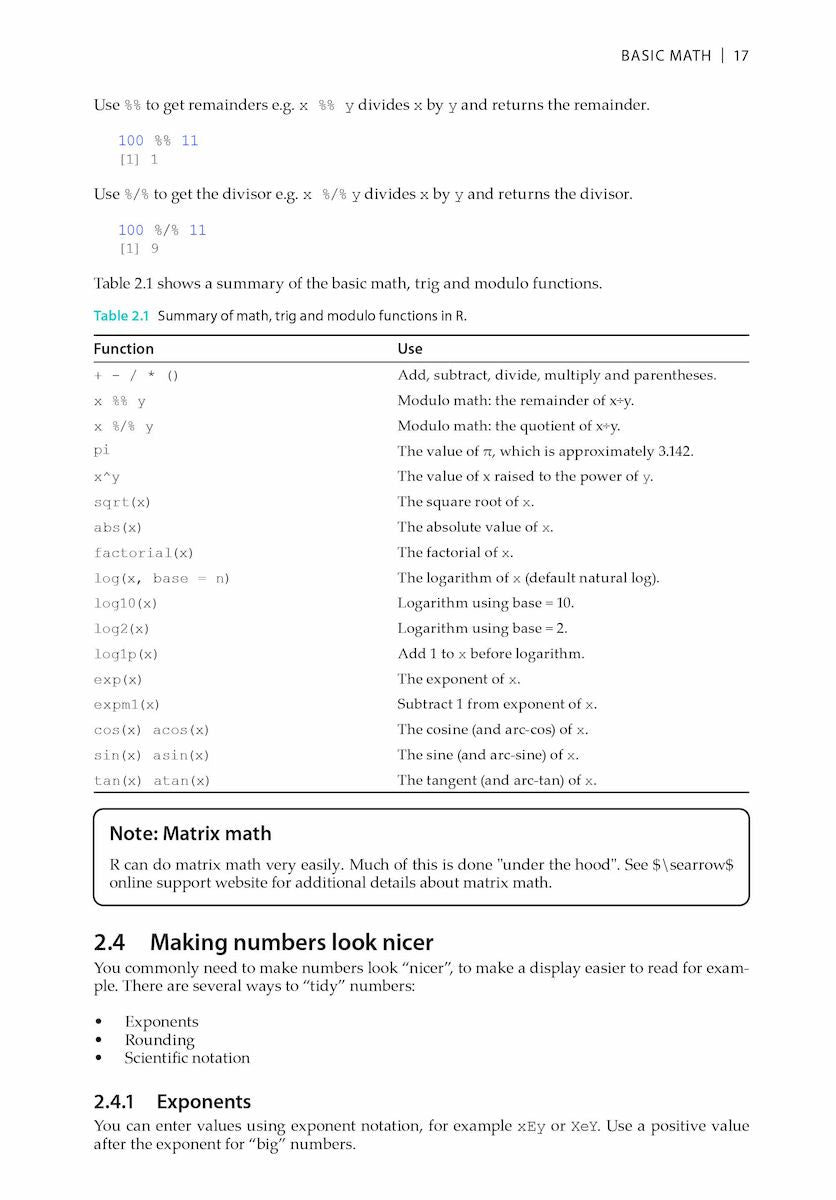
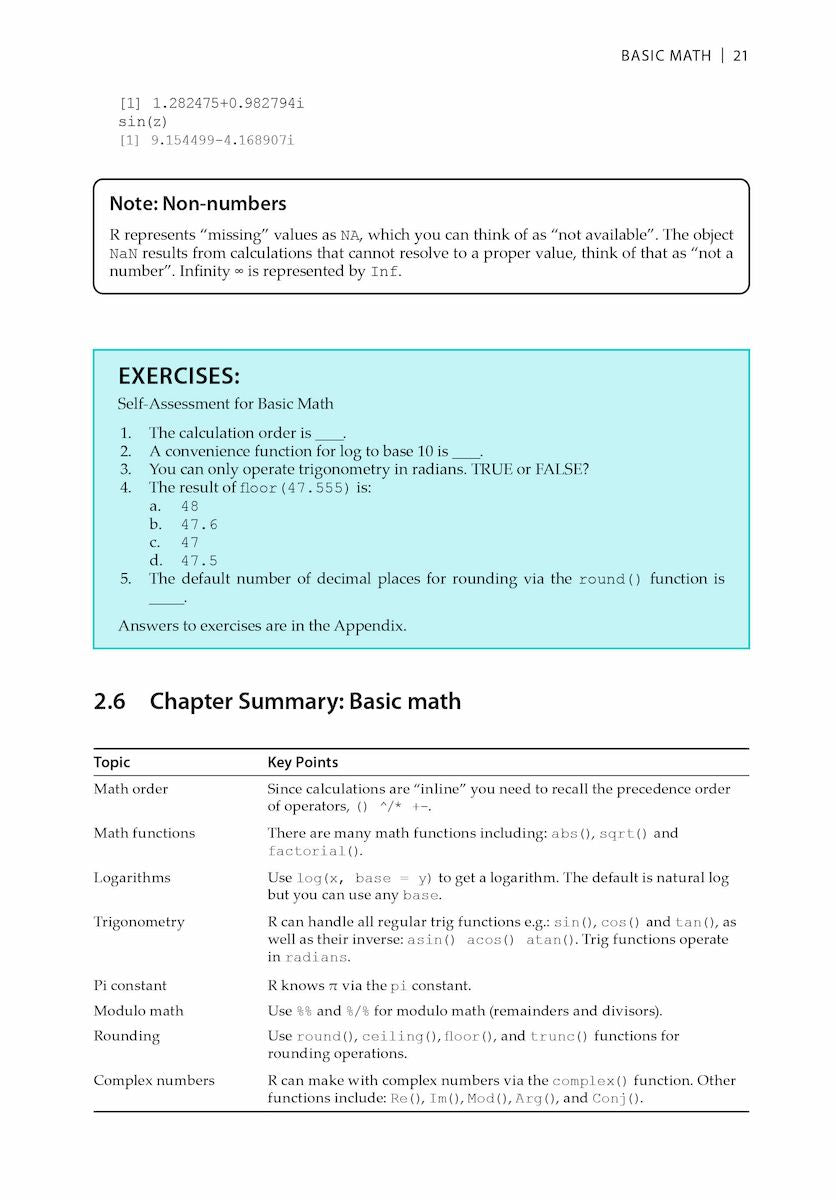
2. Basic math
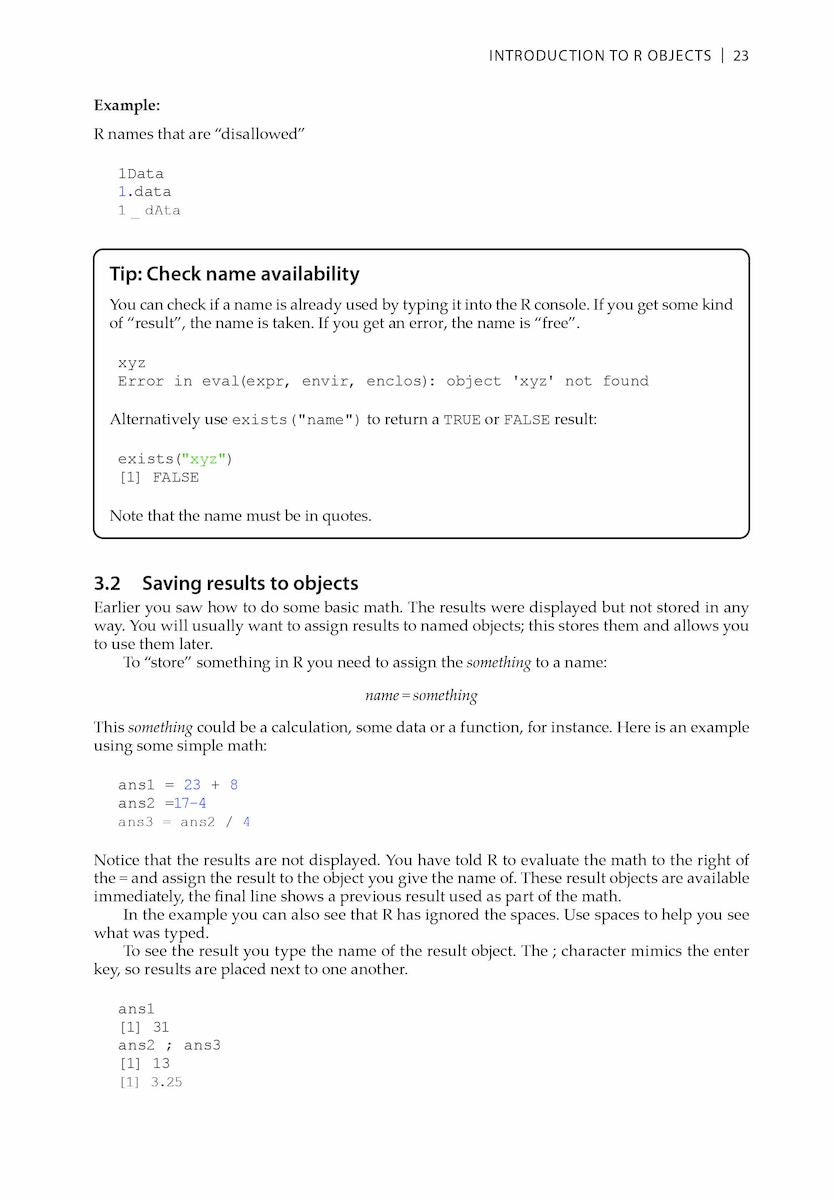
3. Introduction to R objects
4. Making and importing data objects
5. Managing and exporting data objects
6. R object types and their properties
7. Working with data objects
8. Manipulating data objects
9. Summarizing data
10. Tabulation
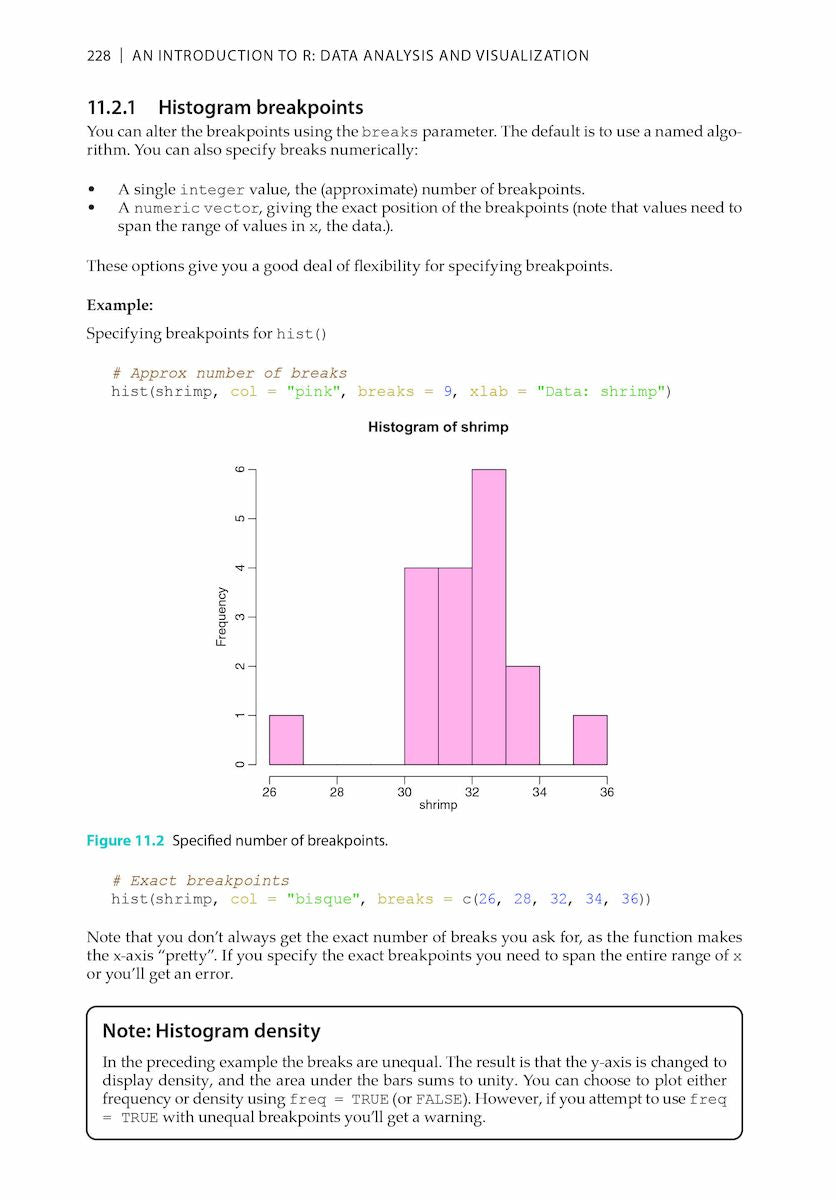
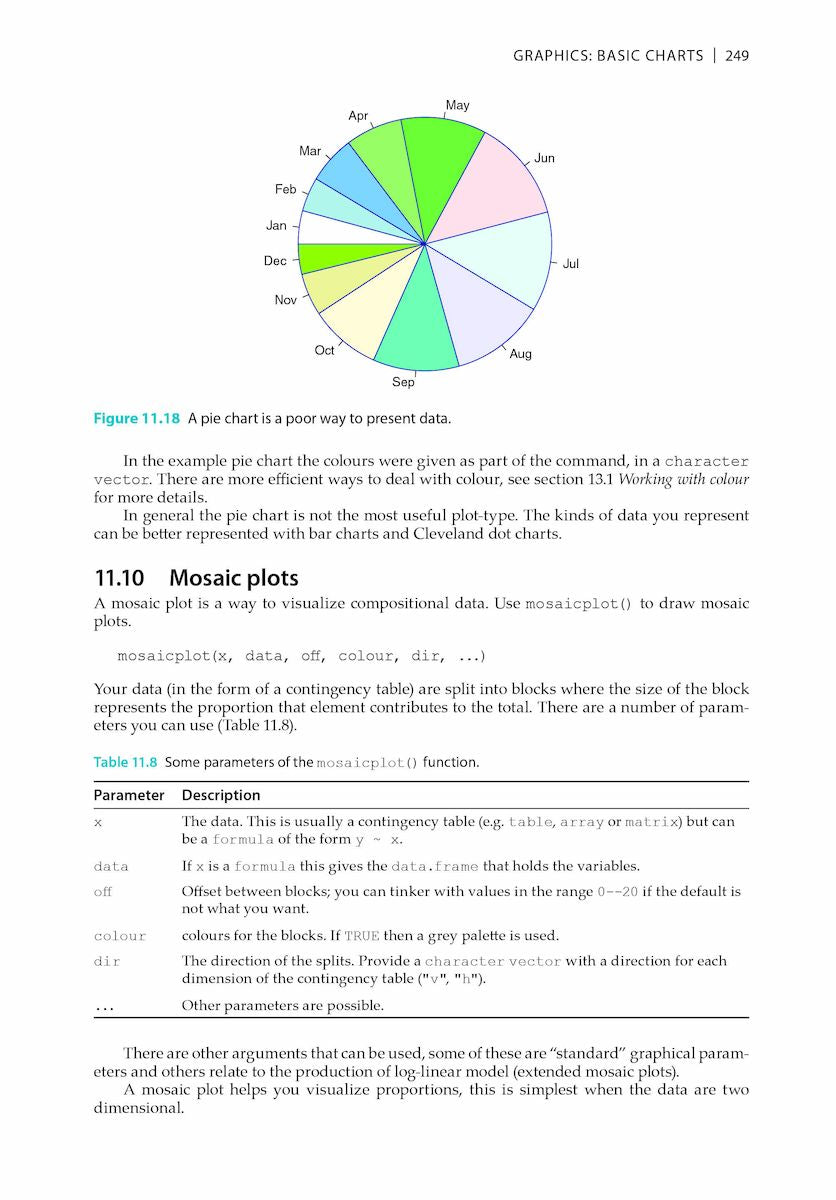
11. Graphics: basic charts
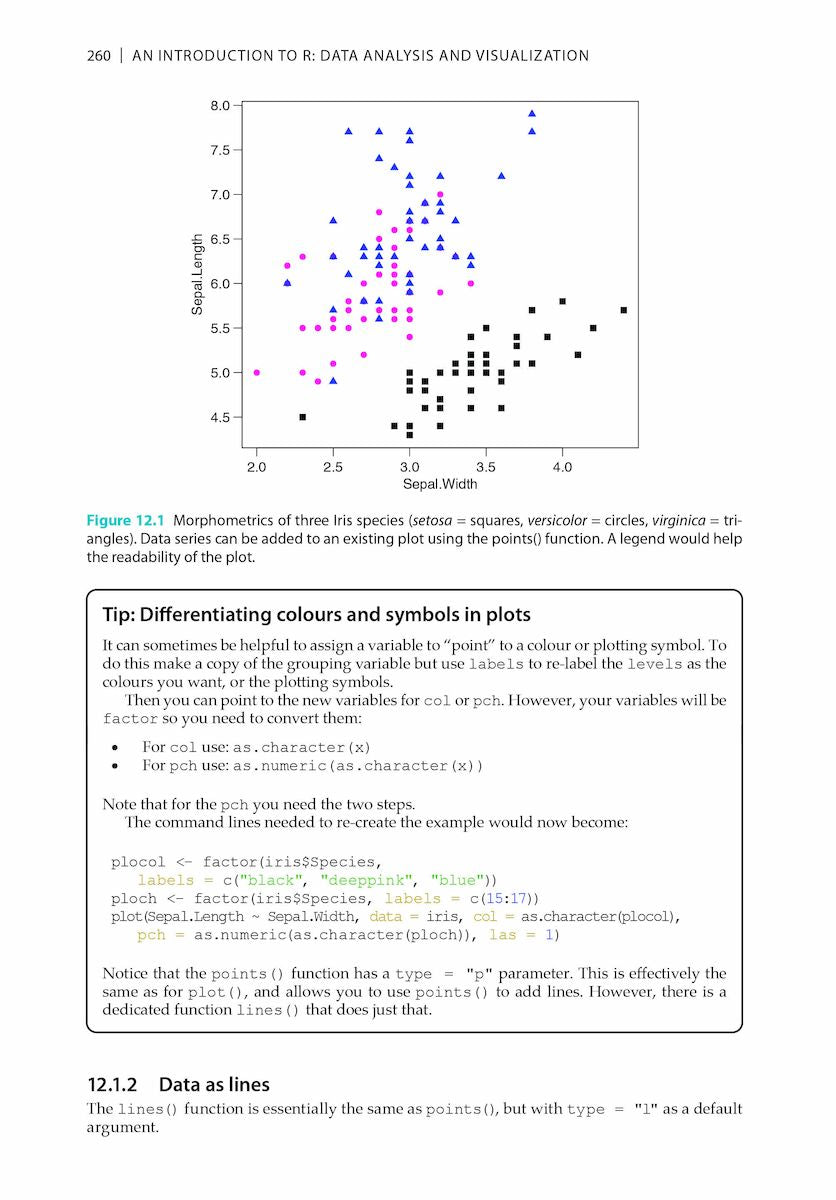
12. Graphics: adding to plots
13. Graphics: advanced methods
14. Analyze data: statistical analyses
15. Programming tools
Appendix
Index
About the Author
Mark Gardener is a self-employed scientist and consultant, with a PhD in ecology. Currently, he provides data analysis and consultancy across a wide range of disciplines. Mark specialises in the use of the R Project for Statistical Computing.Bibliographic Information
 384 pages
 - 54 figures
- BISAC COM021030, COM077000
- BIC GPH, UNC, UFM